
Since its introduction a decade ago the h-index has rapidly become the most frequently used measure of research productivity and citation impact amongst scientists. It’s far from perfect and has been criticised from a number of perspectives, particularly when used as a blunt tool for assessing a scientist’s “quality”. Nonetheless it’s a useful measure that allows some comparison within research fields and (I think more importantly) gives individuals one method, amongst any number, of assessing the influence their work is having on their discipline.
Put simply, an individual’s h-index is calculated by ranking their publications by number of citations; the point at which the rank position of a publication is at least equal to the number of citations for that publication is the h-index. For example, if a scientist has 18 papers all with at least 18 citations, their h-index is 18. As soon as another publication reaches 19 citations, their h-index will go up to 19, and so forth.
That’s an important point about the h-index (and indeed all other measures of success/impact/whatever) – they are not static and they change over time. As the Wikipedia entry that I linked to above notes, the originator of the index, Jorge Hirsch, suggested that 20 years after their first publication the h-index of a “successful scientist” will be 20; that of an “outstanding scientist” would be 40; and a “truly unique” scientist would have an h-index of 60. However, this will vary between different fields, so any comparisons are best done within a discipline.
One question that I’ve not seen widely discussed is how an individual’s h-index changes over time (though see Alex Bateman’s old blog post about “Why I love the h-index“, where he refers to the “h-trajectory”). Does the “successful scientist” typically accrue those 20 h-index points regularly, 1 point per year, over the 20 years? Or are there years when the h-index remains static and others when it increases by more than the average of 1 point per year? If the latter, what’s the largest annual leap in an h-index that one could reasonably expect? Finally, if we were to plot up the h-index over time, what shape curve can we expect from the graph?
On one level these are purely academic questions, the result of some musing and window gazing during a bus ride between campuses a couple of weeks ago. But there’s also a practical aspect to it, if scientists wish to track this measure of their career progression. For an early career scientist starting out with their first few publications, it’s easy to record their h-index as it changes over time from this point forward. But what about a mid- or late-career scientist who started publishing long before the h-index was even thought of? How do they reconstruct the way in which their h-index has evolved over time, should they be so inclined?
As far as I know there’s no simple, automatic way to do it (but please correct me if I’m wrong). Indexing and citation systems such as Web of Science and Google Scholar give the current h-index and no indication of past history, you have to work it out for yourself. Which is what I’ve done, and the procedure below is (I think) the most straightforward* way of reconstructing the evolution of an h-index.
So, pour yourself a cup of coffee** and settle in for a bit of academic archaeology.
I’m going to demonstrate the process using Web of Science (WoS)***, but it should be identical in overall procedure, if not in detail, in Google Scholar, Scopus, etc. However be aware that Google Scholar is much less conservative in what it counts as a citation, hence h-indexes from that source are typically significantly higher than from others.
The first thing to do after you’ve logged on to WoS is to perform a Basic Search by author name, across all years; I’ve done this for All Databases as some of my**** publications (specifically peer-reviewed book chapters) are not listed in the WoS Core Collection database (the default selection):

Perform the search then select Create Citation Report. This will return a pair of graphs showing number of publications per year and number of citations per year, plus a table with some metrics about average citations per year, etc., and a value for the current h-index of that author:

Below that is a list of publications for Ollerton, J ranked by number of times cited:

As you can see, WoS indicates that the h-index of Ollerton, J is 23. That’s incorrect, it’s actually 22 (i.e. a not-quite-successful scientist) because despite having a relatively uncommon name, there are other people called Ollerton, J who publish (including my cousin Janice). However it’s a simple matter to remove any publications that are not your own using the check boxes against each publication and the “Go” button. Ignore any publications that are ranked lower than your h-index.
Once you have a clean list, use the drop-down menu underneath the page to save your list as either a text or Excel file; again, just save the publications that are contributing to your h-index by choosing the number of records that corresponds to your h-index [UPDATE: however see Vera van Noort’s comment below about the possible influence of early publications that were only cited once or twice on your early h-index. UPDATE x 2: see also the later comments by Alex Bateman and Vera – later publications can drop out of the h-index list too. This wasn’t an issue for my set of publications, but it’s worth checking if you’re following this procedure].
The Excel***** file is easiest to work with: it provides you with the two graphs shown on the WoS citation report plus details of the publications, average citations and so forth, and all the raw data on number of citations per year back to 1950 (click on each image for a larger view):

To make the spreadsheet easier to work with I advise deleting all the stuff you don’t need, including the figures and the columns from 1950 up to the date of your first publication.
You now have to calculate cumulative number of citations over time for each publication using the Sum function (I’ll not go into details, should be straightforward if you know your way around Excel).
Next, copy all of the data and paste-special onto another sheet, selecting “values” (to just paste the data, not the formulae) and “transpose” (to turn the data 90 degrees) from the paste-special options. Remove the original data to just leave the cumulative citations and then select all of the data and use the Custom Sort function to order the rows by by date of publication:
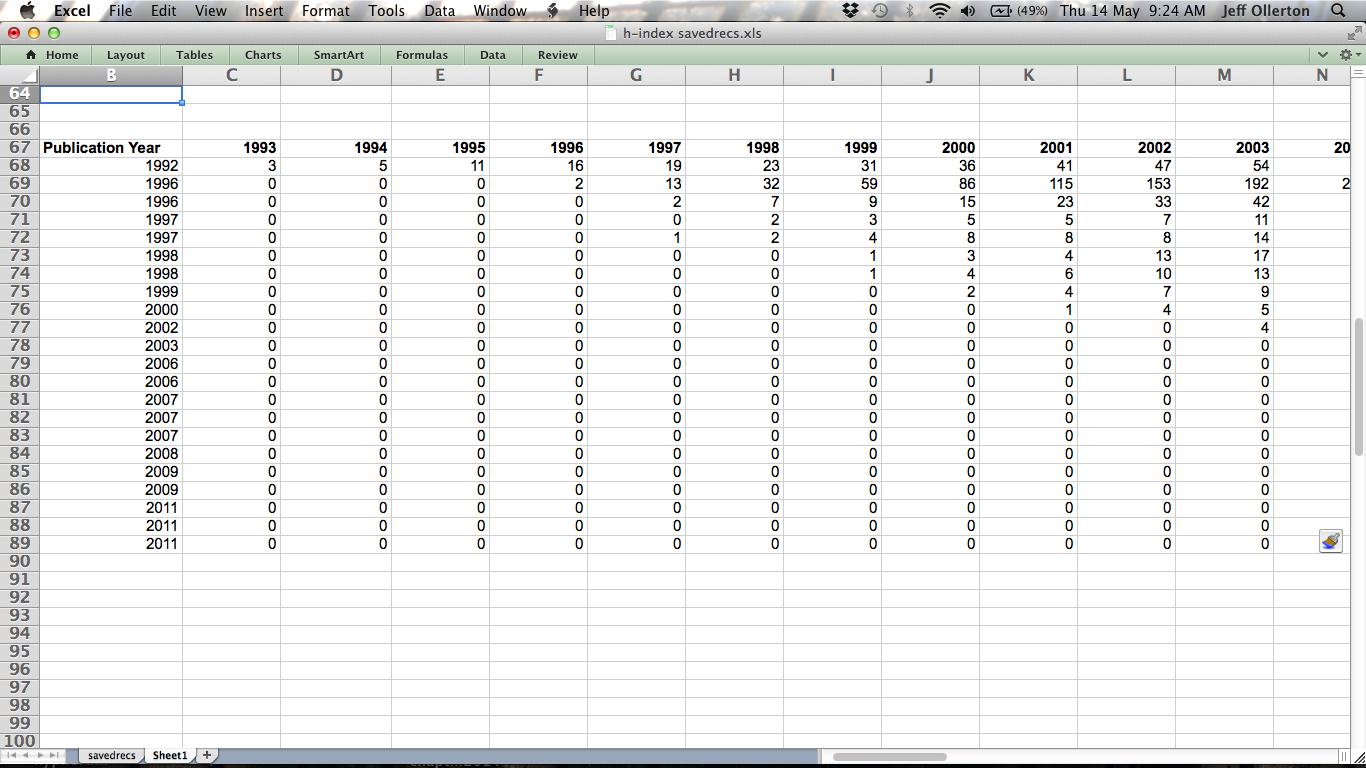
Now it’s a matter of going along the columns and recording the number of publications that exceed the h-index for the previous column; I’ve colour-coded this below to make it easier to see:

Finally, graph up the data:

The results are interesting (or at least I think so). In relation to the questions I posed above its clear that there are periods when the h-index doesn’t increase for a couple of years; more periods when the h-index increases by one each year; and a couple of years when the h-index increases by 2 points. But that’s the maximum and I suspect that increasing by 3 or more index points in a year would be very unusual indeed (though see my second point below).
Although there’s a clear “lag phase” in the first five years when the h-index hardly changes, there are also periods when there’s no increase in h-index much later, e.g. 2013/14, so this stasis is not restricted to the beginning of my career.
Some final points:
1. Make sure your citation data on Web of Science is accurate. I have found LOTS of mis-citations of my publications over the years, by authors who include incorrect dates, volume numbers, page numbers, even authors, in the references they cite. WoS has a facility for correcting these mis-citations, but you have to let them know, it’s not automatic.
2. How representative are my results for the population of ecologists or scientists more generally? I have no idea but I hope others go through the same procedure so that we can begin to build up a picture of how the h-index evolves.
*No doubt this could be automated in some way and perhaps this will stimulate some competent programmer or app developer to do so, but doing it by hand is so straightforward that I’m not sure it’s worth the effort of constructing a working system. Certainly the Excel part of the procedure could be done more elegantly in R.
**Other beverages are available.
***Other indexing and citation systems are available.
****Other scientists are available 🙂 But it doesn’t seem fair to use someone else as an example. In any case, consider this another post reflecting on my life and career in my 50th year on this planet!
*****Other spreadsheets are available. That’s the last one, promise.

Pingback: A brief history of your h-index | Research Support Hub
Jeff – it hadn’t occurred to me to graph this for my own record. Nice idea! But at one point, as an administrator, I did plot h-index for members of a medium-sized academic unit against their years post-PhD. That’s a similar analysis except horizontal rather than longitudinal. There was of course scatter (the residuals, in fact, were what I was after), but relevant to your post, the underlying relationship appeared to be quite linear. That matches your finding of a fairly smooth, almost-straight-line increase. – Steve
Thanks Steve.
Yes, I did a similar analysis of a group of scientists in my field a few years ago to see where I sat within that cohort (and in fact whether the publication/citation evidence justified me applying for Full Professor).
Likewise, I found a linear relationship with a lot of scatter. But within that there’s clearly going to be a lot of personal differences in how individuals have arrived at their current h-indexes. When you consider scientists who have 3 or 4 times the average h-index for their career age and field, it would be interesting to see where in their career the rate of publishing and citation suddenly went into overdrive. Jeff
Yes. I think our h-vs-age plots suggest smooth linear increase on average, but if someone is well above (or below?) that curve, the shape that got them there would be interesting. Coincidentally, by the way, Jeremy Fox just posted on how we think about averages over at Dynamic Ecology (http://wp.me/p2wMuW-3nM) – not related to h-index, but to your point about the scatter vs. the average.
Thanks, I’ll post a link over there.
Nice post Jeff. Its nice to see some more love for the H-index 😉 The rate of growth of the H-index is called m. Its basically the gradient and its a very useful measure. But it doesn’t capture other features of how the H-index changes over time. I am an obsessive citation tracker and so have not only my H-index over time but also how my m changes over time. Over the last 15 years or so the number of H-index points I’ve been gaining per year has been growing. From about 1.5 per year in the early days to about 2.5 per year nowadays.
To calculate the H-trajectories for the three scientists in the graph in my blog post “Why I love the h-index“ I also used ISI Web of Science, but in my case I downloaded all the citations for three scientists and then used a perl script that extracted the year the citing paper was published and which paper it cited. I could then use that data to calculate the year by year increase in H-index. On the minus side there is a limit to how many citations you can download at a time from ISI, so I didn’t bother to run the code on my own record as it would have been laborious to download all the data manually.
I completely agree with your final point 1. Find and use the Cited Reference Search option in ISI to identify citations they haven’t linked correctly to your record. I have found papers where literally hundreds of citations are missing! For papers that have almost enough citations to affect your H-index you may only need to find one or two missing citations to increase your H-index!
Many thanks Alex, that’s useful to know. Just occurred to me that I could use the piecewise regression approach that we used in a recent paper on pollinator extinctions to determine periods when m changes – see: https://jeffollerton.wordpress.com/2014/12/13/extinction-of-british-bees-and-flower-visiting-wasps-a-new-assessment-of-rates-and-causes/
That might be using a sledgehammer to crack a nut though 🙂
“just save the publications that are contributing to your h-index” I think this is wrong as early publications may first contribute to the h-index and then go out. Now you are only recording the increase in citations of publications that are currently in you top list, which results in a smooth curve. It is probably more rugged if you include all publications.
Thanks for that Vera. I did look at this when I was downloading my data and there were no early publications that dropped out of the h-index list. But I agree it’s possible in theory (though I think it would be unusual). I’ll update my post to reflect your comment.
Yes that is correct. I have seen papers that contributed to my H-index in the past drop out over time.
OK, thanks, just put in an update. Was that only something that happened in the early days of your h-index, Alex, or have you seen it more recently?
Has happened across my whole publication history.
Hmmm, ok. In which case it’s necessary to download the data for all papers. Rats, should have thought that through earlier.
I did the exercise for myself and for Peer Bork. For me one early paper recently dropped from the list as it was overtaken by more recent papers with more citations. For Peer happened a lot over all years.
Thanks Vera. I will update the update 🙂
Thanks for the interesting post. The original paper where Hirsch introduced the h-index addresses some of these issues. In particular, a simple model suggests that h should increase approximately linearly with time (with slope m that alexbateman mentioned).
Seems like a stochastic version would be needed to get at what kind of jumps are expected (vs a sign of a change in productivity). Anyone know whether that’s been done?
I’m not a huge fan of h (or m=dh/dt). It’s a step in the right direction, but obviously has some issues (such as the integer values). I’ve worked on this some in the context of “faculty metrics” which come into and out of favor — should take a weekend to summarize and get feedback from the rest of the world some time.
Thanks for that. As far as I’m aware no one has produced the kind of model that you’re suggesting.
Yes, I’m sure that the h-index and its derivatives can be improved, and there have been various suggestions, but it remains popular in part, I think, because it’s simple.
Thanks for the interesting post Jeff. I find the change in m very interesting. Given the 8-9% growth rate in science in general (see e.g. this arxiv paper http://arxiv.org/abs/1402.4578) the likelihood of becoming cited should also increase over time as the ‘market’ grow up. As with any other currency (assuming that the h-index is kind of a scientific currency) we should have an inflation over time in phases of a growing market. By that the originally intended 20-40-60 ‘rule’ Hirsch proposed back then is likely to be outdated and that we might be now at a ranking of, say, 25-50-75 (depending on the field of course). The same counts also for journal impacts given the steadily growing number of citable journals and papers… An journal IF of 3 is not the same as it was 10 years ago… It would be interesting to estimate this inflation rate (and maybe correct for that). – best Jan
Thanks a lot Jan. H-inflation is an interesting perspective that I’d not considered, I wonder how it could be measured? Perhaps some ideas could be taken from the economics literature?
Of course if Hirsch’s rule is now 25-50-75, that makes me and even-less-successful scientist! 🙂
Mmmm, if it makes you feel any better, apparently you can get offered a professorship in a Centre with an H index of 3 (well, you can if you’re Bjorn Lomborg anyway)!!
I heard recently that they’ve withdrawn the offer to Lomborg, which is good news all round.
Yep, great news, though as a mid-(unimpressive)-career humanities scholar with an H index better than Lomborg’s, the momentary lifting of someone with such a lowly H index did make me feel less depressed about my own research record!
It’s easy to become over-focused on single metrics such as the h-index; best to look at a career in the round I feel.
Pingback: The Altmetric Bookmarklet – an instant measure of the reach of academic publications | Jeff Ollerton's Biodiversity Blog
Pingback: The Altmetric bookmarklet – a researcher view | Research Support Hub
Pingback: How many non-peer-reviewed publications should a scientist produce? | Jeff Ollerton's Biodiversity Blog
Pingback: Do reference management systems encourage sloppy referencing practices? | Jeff Ollerton's Biodiversity Blog
Pingback: You can’t estimate your odds of getting a faculty job from common quantitative metrics | Dynamic Ecology
Pingback: What’s the point of the h-index? | Jeff Ollerton's Biodiversity Blog
Jeff, Your h-index is 30 on ResearchGate! Do they use a different system?
https://www.researchgate.net/profile/Jeff_Ollerton/reputation
Yes, RG, GS, WoS, Scopus, etc. etc. all give different figures because they count different numbers of citations, do/don’t include book chapters, etc.
Hi, I want to try to make H-trajectory graph as your post, but I stopped by the step “Now it’s a matter of going along the columns and recording the number of publications that exceed the h-index for the previous column.” I know the definition for H-index. However, what if I want to find the H-index for an author’s publication in 2006, should I count the citations only in 2006? Or the citations should go through 2006 to 2017? Besides, what’s difference from count the past history H-index manually and find each year’s H-index by Web of Science? I mean, I can set to find the h-index for 2004-2004, 2005-2005, 2006-2006, etc. So why don’t we just search and record them?
Hi – thanks for the comment. The h-index is a cumulative score that can’t go down over time, it can only ever go up (as citations and publications accrue) or stay the same (if one does not publish any more outputs or if work stops being cited).
If you do a Web of Science search for an author in each year you will find that the h-index it returns goes up and down in different years. I think that’s because it only counts citations to papers published in that time period.
So if I do a search for my publications in 2010 WoS returns an h-index for me of 2 because I published two papers that year, each with at least two citations in the period 2010 to now. But the same search for 2009 tells me my h-index was 6. Clearly that can’t be the case, so WoS isn’t calculating an annual h-index in the same way as I’m describing.
Does that help?
Hi Jeff, Thank you so much for your reply. It’s really helpful! If I want to see the past history H-index (H-trajectory), I’d better counting them in your way. However, how about use the WoS to track the overall H-index for the author’s career? For example, if I do a search for someone from 2000 (the start year of career) to 2017 in WoS, is the overall H-index accurate?
Moreover, could you clarify how to count the H-index for each year like the graph that you had color coded? For example, if there were two publications had been cited in the year 2005, the first publication had only one citation, the second had two citations. I think the H-index for 2005 should be one, is that right?
Thank you!!
Hi Shuyan – glad you found it useful. The WoS h-index is reasonably accurate, though you have to check that it’s not including other people’s papers. But it doesn’t always include books and book chapters (though that’s getting better), or papers from journals that it doesn’t index. In that respect Google Scholar has a wider coverage but includes a lot of grey literature such as reports. So a lot of people cote both WoS and GS h-indexes on their CVs.
Yes, in the example you give, the h-index would be one.
Jeff
Hi Jeff, Thank you for your explanation for WoS. However, I have a question for their m-value. If the WoS and their CVs had a different year for the first publication, and I used the H-index from WoS. Which year should I count as the “first year”? Sorry I have so many questions. Thank you so much!
Use the year from WoS because it probably means that the earlier publication has not been indexed by WoS therefore any citations it accrues would not count towards the h-index.
Hi Jeff; just a note; the h-index is a dumbconcept , though Hirsch’s original paper is loaded with useful thoughts, including stuff beyond/in-addition-to the h-index.
suppose one has an h-index of 50-75…that means ones scientific contribution is not increased by having any pub cited more than 50-75 times. a pub that reaches beyond the 50-75 range no longer adds anything. But that’s dumb, its just too low.Better to just use all pubs cited better than 100, or 200. Hirsch discusses this but considers the cut-off arbitrary. Any index that does not see the importance of pubs cited several hundred times is silly.
Hi Ric – thanks for the comment. I appreciate what you’re saying, but the advantage I see for the h-index is that it takes into account numbers of outputs not just numbers of citations. Now it’s possible to argue that an individual who produces one book or paper with 10,000 citations is going to be more influential than a second individual whose career culminates in an h-index of 50, and certainly Darwin’s h-index must be fairly low! But most modern scientists are not in the position of producing just one or two outputs in their entire career. So how do they track the influence/reach of their work? Raw citations is certainly one way to do it, but that also has disadvantages that have been widely discussed. The other thing to note is that, as scientists move into mid- and late-career, it’s possible to calculate variants of the h-index that capture the highly cited outputs, e.g. h50-index, h100-index, h1000-index. Google Scholar already does this with its i10-index showing the number of outputs with > 10 citations.
Even Hirsch realized the index did not capture people with few pubs, but many cits.
Consider Bob trivers:
http://scholar.google.com/citations?user=lLppkZQAAAAJ&hl=en ;
5 highly cited papers, and 2 highly cited books. a low h index, 41.
Same for Robert MacArthur.
Nothing beats just counting total cits.
Actually there is a 2 dimensional plot that captures the spirit of total cits and # papers sensibly cited. Hirsch discovered that [total cits] was proportional
h{squared} and the coefficient was 3-5. A coeficient above 5 meant that the person had relatively more more highly cited pubs. So he proposed using h, AND the ratio of [total cits]/h{squared} as an index . I did this for a dozen ecologists on GoogleScholar, and yup, the ratio is 3-5. Trivers is at 23, with h=41.
That’s interesting, thanks Ric. It’s been a while since I looked at Hirsch’s original paper and I’d forgotten about that. I ‘d speculate that the coefficient approach has not been widely adopted as it’s not so intuitive or easily interpretable as the h-index.
Indeed very interesting article! I am a PhD student and I am wondering if it is better for practical -apart from social- reasons- and personal reasons to publish only or mainly at open access. Is this better for enhance h-index? And also, what if in a year (finishing PhD) there are a lot of publications (ie 8) and in the next (writing thesis) are much fewer (ie 1). Should the researcher/student have a “plan” for the years/publications?
Personally I think it’s better to publish in a range of different ways; open access is great if you can afford to pay the publisher, but if not then advertising your research via a blog and Twitter should let people know the work is out there. Whether it makes a difference to the h-index is debatable. It’s always good to have a publication plan but if the number of papers you publishes varies a lot from year to year I wouldn’t worry too much about it. Quality is better than quantity!
I agree also support quality is better than quantity… As I understand h-index creates something like a “Golden section” of these both. So quality sometimes is not enough.
Yes, though I’d not get too hung-up on your own h-index, there are more important things to be concerned about such as obtaining grants.
Thank you very much!
Pingback: Which h index should I use? | Jeff Ollerton's Biodiversity Blog
Pingback: What are my most read blog posts of 2018? A short review of the year | Jeff Ollerton's Biodiversity Blog
Pingback: Seasonal blog post views are a widespread phenomenon: a response to Leather (2020) | Jeff Ollerton's Biodiversity Blog
when I had citations 182 my H index was 8 , now my citation is 192 but my H -index decrease to 7 .Why?
Hello Hadi – that does seem odd. I wonder if one of your papers was duplicated on Google Scholar and they deleted the duplication?